.webp)


A LinkedIn impression is one instance of your content appearing on a screen for at least 300 milliseconds, with at least 50% of the post visible. It measures distribution, not whether a prospect read, believed, or acted on the message.
What a LinkedIn Impression Means
The biggest mistake teams make is treating impressions like proof of interest. They're not. An impression only says LinkedIn showed your post on a member's screen long enough to count it as visible, which is very different from a buyer paying attention.
For B2B sales, that distinction matters because pipeline does not come from passive exposure alone. A prospect can rack up impressions by scrolling past the same content multiple times, and that still doesn't mean they engaged. LinkedIn defines impressions as an estimate, so the raw number should stay in the awareness bucket, not the revenue bucket.
Practical rule: if a metric can rise without a prospect replying, clicking, or accepting a connection, it is not a sales outcome metric.
That is why I define impressions narrowly when I train SDRs. Invite sent, accepted, replied is a usable funnel. Impressions sit above that funnel, useful for awareness, but too soft to steer outreach decisions on their own.
If you want to separate passive visibility from active viewer behavior, a tool built around viewers-only analysis is more useful than a dashboard that celebrates empty reach.
How LinkedIn Counts Impressions Behind the Scenes
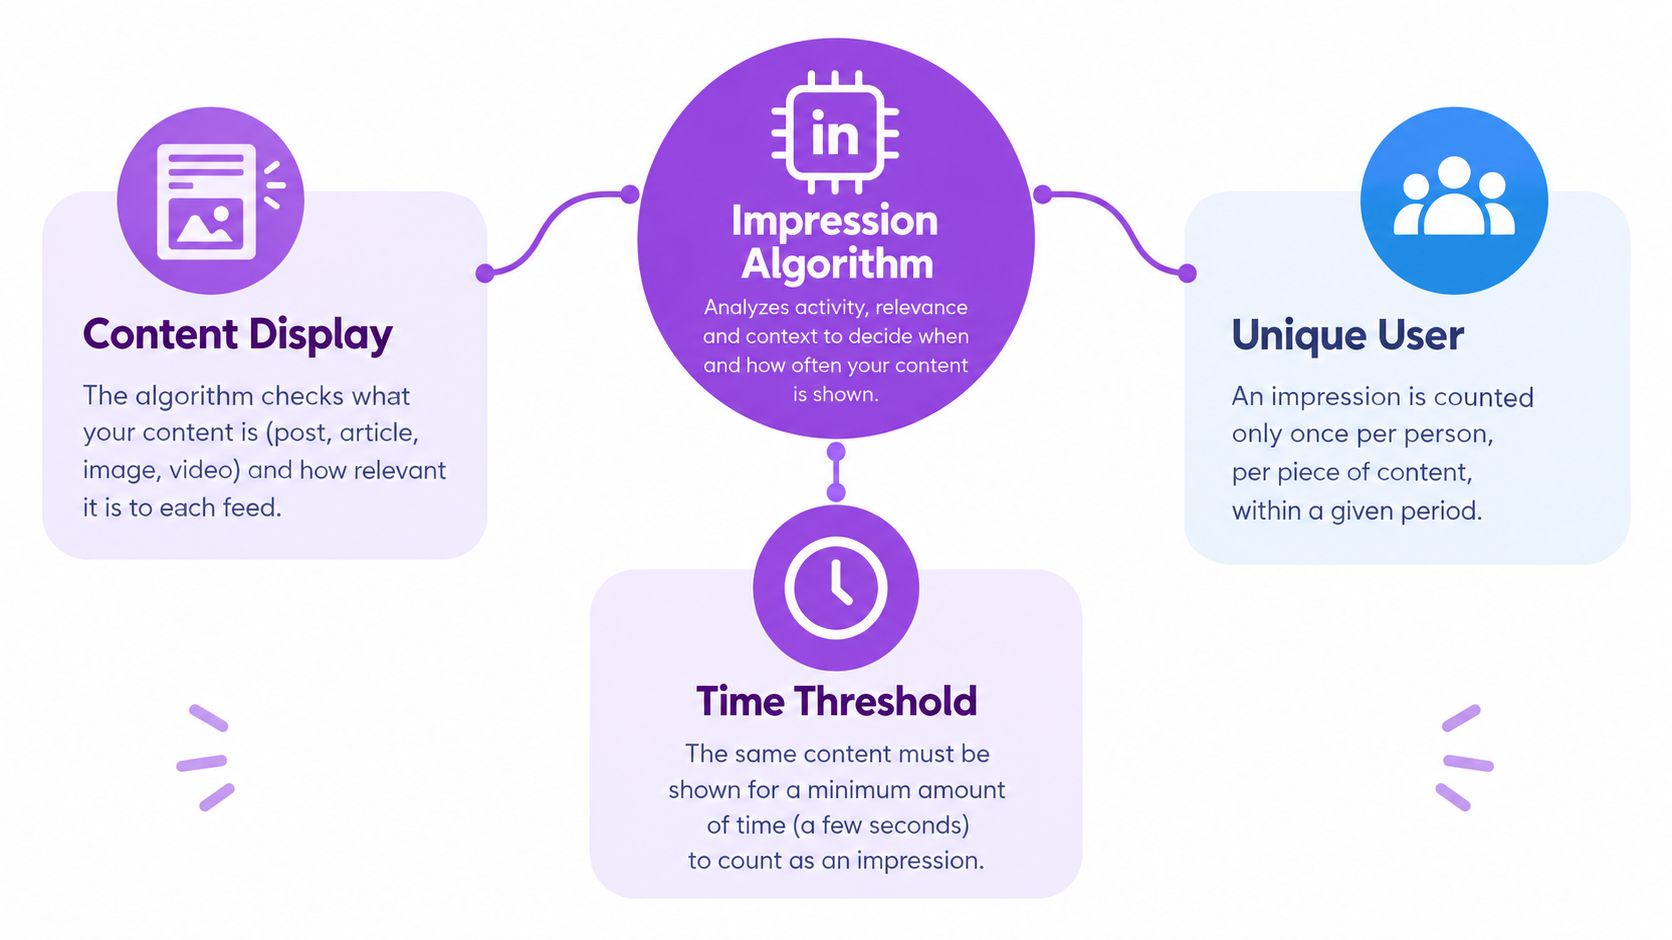
LinkedIn does not count every glance as an impression. For organic content, the post has to be at least 50% visible on a signed-in member's screen for 300 milliseconds or longer to qualify, according to SocialInsider's LinkedIn impressions breakdown. That short threshold is why an impression tells you about visibility, not whether someone read the post.
Why the 300-millisecond rule matters
A feed moves fast. If someone scrolls past quickly, the post may never qualify. If it stays in view long enough, it does. So impression volume shifts with scroll speed, feed placement, and how much of the screen the post occupies, not just with content quality.
A post that flashes for a split second can still fail to count. That makes raw impression totals noisy in fast-moving feeds.
Dense layouts usually suffer here. If the opening is cluttered, the viewer keeps scrolling. If the hook is clear and the format is easy to scan, the post has a better chance of staying on screen long enough to register. The metric responds to stop rate and view duration, not just posting effort.
What inflates or suppresses the count
Repeated exposure also matters. The same member can generate multiple impressions if the post appears again in the feed, search, or another surface. That makes impressions non-unique, so the count can overstate how many distinct people saw the content.
A post with 10K impressions and only 2 replies is a good example. The number says the content surfaced often. It does not say the audience cared enough to act. For an SDR team, that gap matters more than the headline count.
The practical lesson is simple. A higher impression total can come from strong distribution, or from the same audience seeing the same post again. Without context, the number can look stronger than the attention underneath it.
Comparing Impressions to Reach Views and Engagement
Impressions and reach are related, but they answer different questions. LinkedIn's analytics define impressions as the number of times a post was shown, while members reached are the number of distinct members and Pages that saw it LinkedIn Help on post analytics. One tells you how often content was displayed. The other tells you how many unique accounts saw it.
LinkedIn metric comparison for B2B outreach
MetricWhat It MeasuresB2B Sales ValueImpressionsTotal displays of a postUseful for distribution, weak for intentMembers reachedUnique accounts that saw the postBetter for audience size and overlapProfile viewsPeople who opened the profileStronger signal than passive exposureClicks, comments, repliesActive responseBest early indicator of interest or intent
A single prospect scrolling past the same post three times creates three impressions, but only one unique viewer. That's the core reason impressions are easy to misread. A dashboard can make a campaign look broad when the same small audience is just seeing the content repeatedly.
For sales teams, the useful question isn't “How many impressions did we get?” It's “Did the right accounts see it, and did any of them take a real action?” In practice, replies, comments, saves, and connection acceptance tell you more about momentum than repeat exposure does.
Where engagement fits
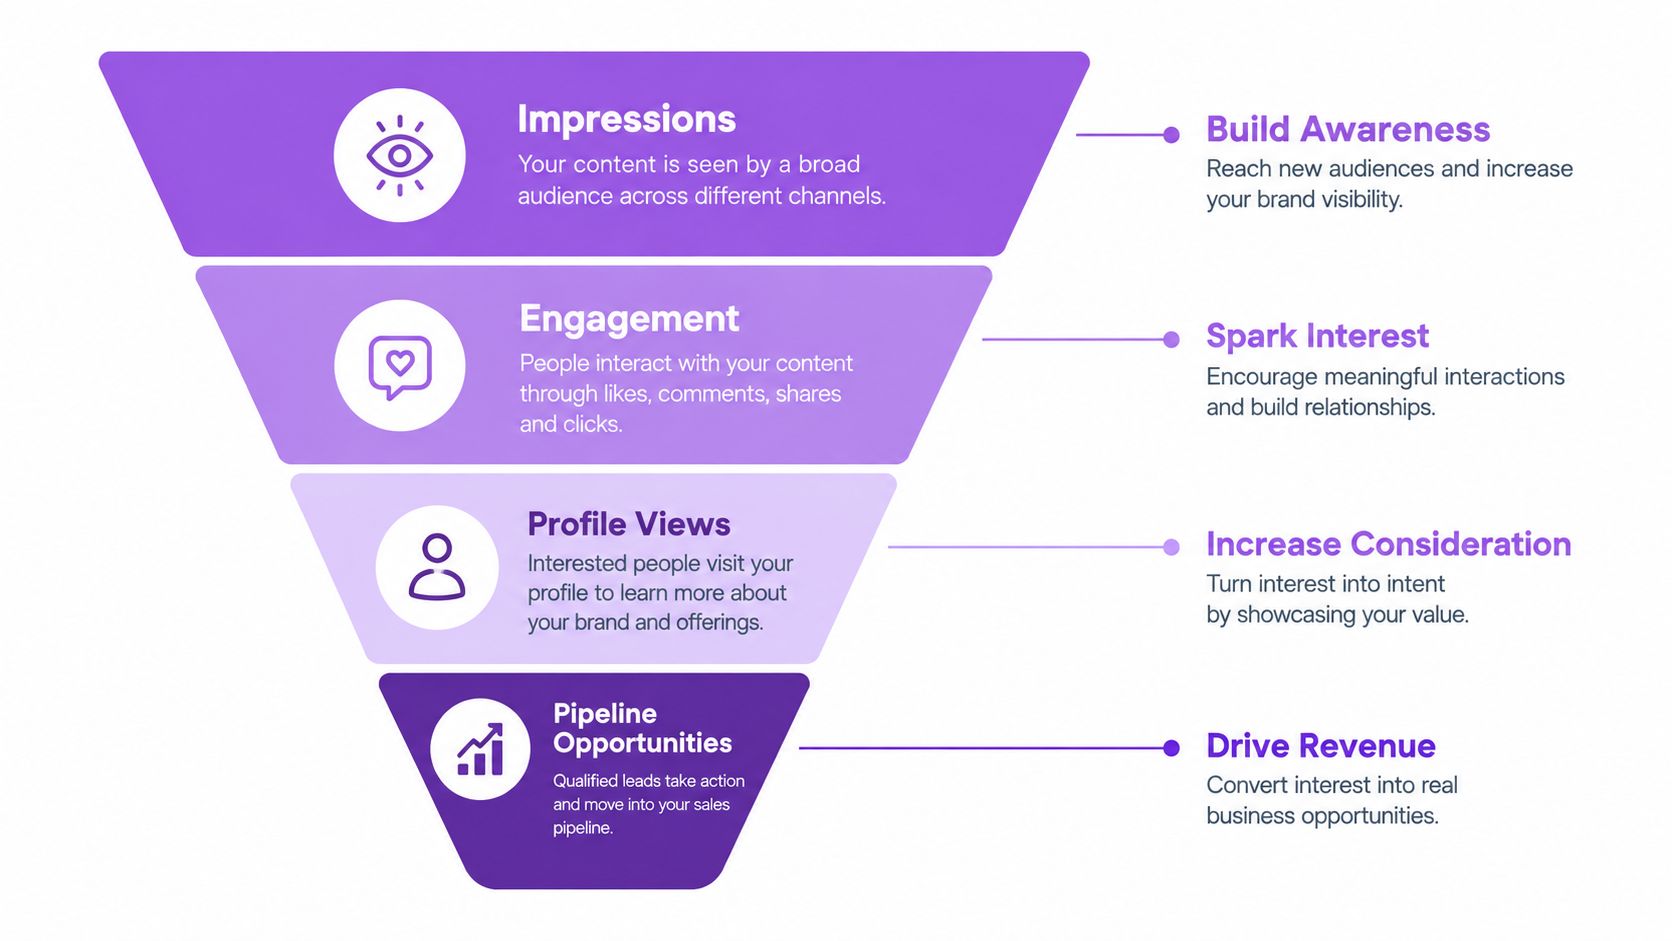
Engagement sits below visibility in the funnel. A post with strong impressions but weak replies usually means the content got distribution without earning interest. A post with lower impressions but more replies is often the better sales asset, because it produced action from the audience that mattered.
That's why I'd rather see modest impressions and meaningful replies than the reverse. For revenue teams, the first number is distribution. The second is buying signal.
Why B2B Sales Teams Treat Impressions as a Vanity Metric
Outbound teams don't get paid for being seen. They get paid when a prospect accepts a connection, replies, books time, or moves into a real sequence. That's why impressions are usually a vanity metric in sales workflows. They can tell you something about exposure, but they don't give you anything you can act on.
The funnel that actually matters
In a LinkedIn-led outreach motion, the useful funnel is straightforward. Invite sent. Accepted. Replied. In the largest campaign shared by the publisher, that funnel produced 352 invites sent, 151 accepted, and 34 replies. The acceptance rate was 42.9%, and the reply-to-accepted rate was 22.5%. The same campaign also sent 265 messages, with a 10.6% reply-to-message rate.
Those are the numbers that matter because they map to action, not exposure. Flowkon doesn't track impressions, and that's a deliberate choice. If a platform can't tell you whether a lead accepted the connection or replied, it's not giving you a useful operating signal for outbound.
What experienced teams do: they follow up only after a connection is accepted, not after a post gets more visibility.
Why raw visibility gets worse over time
LinkedIn visibility has become harder to win at scale. One LinkedIn-posted update reported organic reach down about 64% from the 2022–2023 peak and median post impressions down about 18% year over year. Another LinkedIn report showed impressions per post down 10% even while total impressions rose 16% because posting volume increased 28%. That's the trap. More posting can make total visibility look healthier while average post performance weakens LinkedIn-posted update.
That's exactly why impressions are a poor north star for SDR teams. If the market is noisier and reach is harder to earn, chasing raw visibility pushes people toward safer, flatter content. Replies come from sharper targeting, tighter hooks, and better timing, not from celebrating the top of the feed.
Where to Find Your Impression Data on LinkedIn
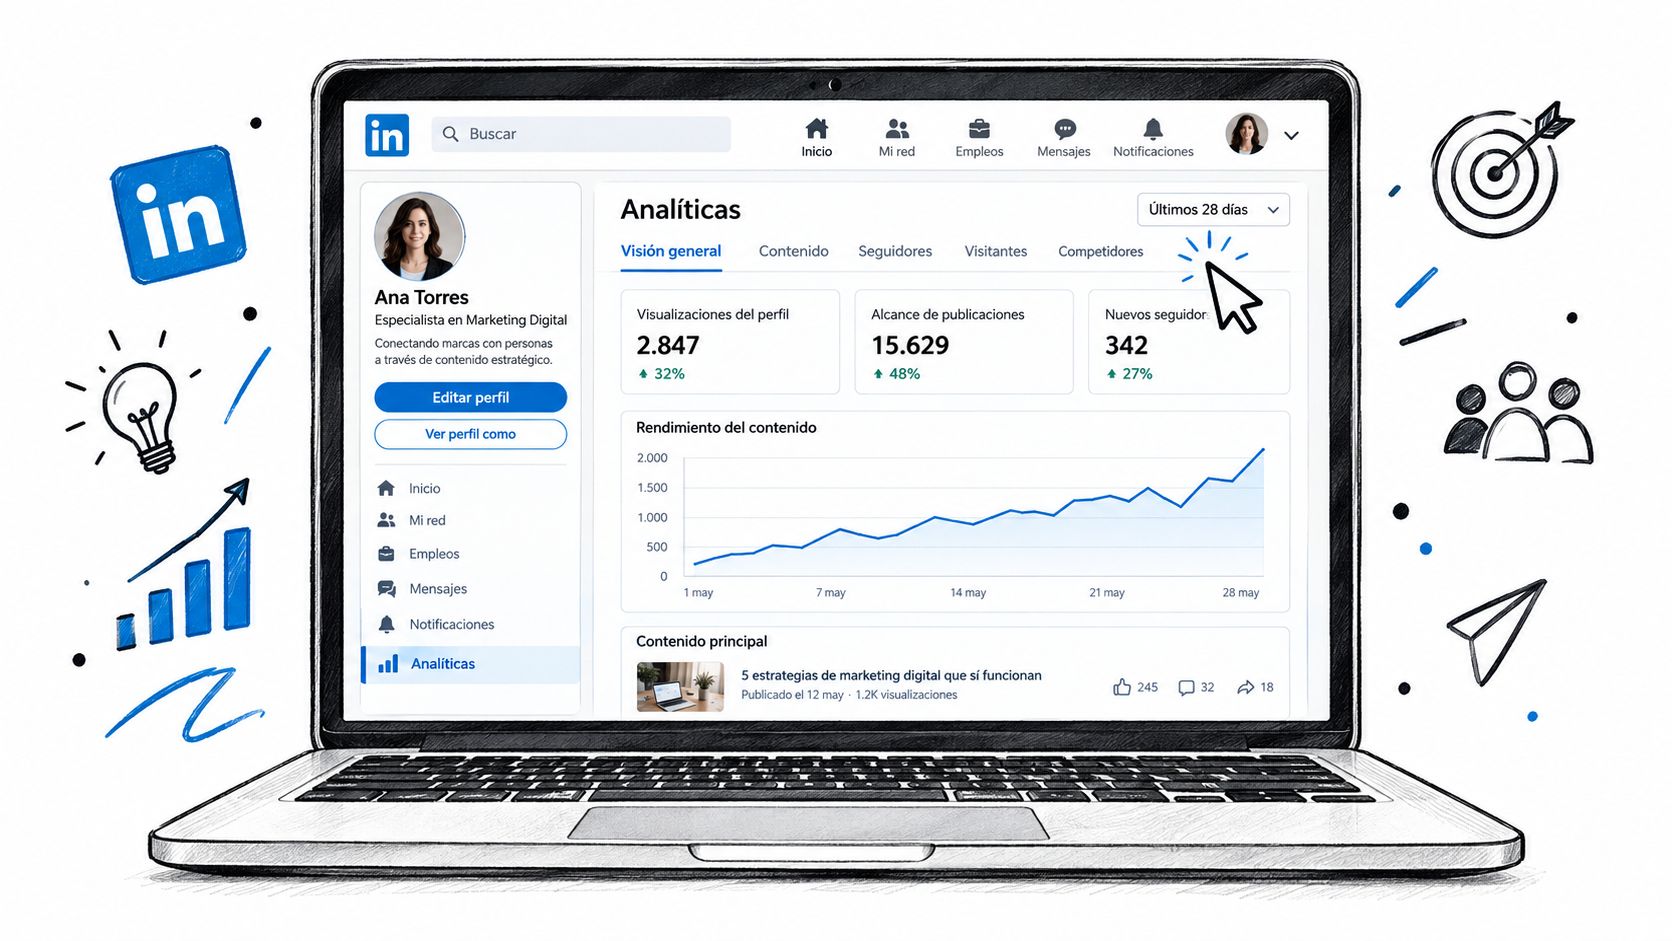
LinkedIn puts impression data in a few places, depending on what you posted. If you want the cleanest read on one campaign, open the post itself and check its analytics view. For profile activity, go to your profile's activity section and review individual posts. For a Company Page, use the Analytics tab, then open Content to see post-level performance.
Start with the post when you are checking one outbound push. That gives you the clearest view of distribution. If you are reviewing a longer run, use profile or page analytics so you can compare posts side by side instead of relying on memory.
The useful part is context. LinkedIn's content analytics show impressions across posts, articles, and other formats, and each additional display counts again even if the viewer does not interact LinkedIn marketing metrics overview. A post can look active on paper while producing very little signal underneath.
What to ignore in the dashboard
A big impression count does not tell you whether the message created movement. If impressions are more than 10 times the number of accepted connections, the audience is likely being re-exposed rather than newly reached. That is common when a post circulates inside the same network, but it does not mean the campaign is helping pipeline.
For outreach teams that want cleaner reporting, Flowkon's dashboard and analytics focus on acceptance rate, reply rate, and other conversion signals instead of making passive exposure the headline.
How to use the data without overreading it
Check impressions alongside reach and engagement, not on their own. If impressions rise but replies stay flat, the content probably improved distribution more than relevance. If impressions are modest but accepted connections and replies are strong, the post probably reached the right buyers even if it never looked flashy.
That is the right operating habit for SDRs and founders. Use impressions as a directional signal, then move quickly to the metrics that show whether the message created intent.
Focusing on Actionable Metrics That Drive Real Pipeline
A large impression count can look impressive and still tell you almost nothing about revenue. Impressions show that content appeared. Acceptance and replies show whether the campaign moved a buyer forward. If an SDR team optimizes the first number, the report gets louder. If it optimizes the second and third, the work starts to resemble pipeline.
The working thresholds that matter
Based on the campaign data shared here, an acceptance rate at or above 40% is a healthy signal. The largest recent campaign reached 42.9% acceptance, which is the kind of result worth protecting with tighter targeting, cleaner invite notes, and steady follow-up. A reply rate of accepted connections below about 25% is the point where I would review the message, the timing, or both.
The goal is not a perfect number on every campaign. It is to find where the funnel breaks. If acceptance is strong but replies lag, the follow-up is usually the issue. If acceptance is weak, the targeting or invite message needs work before more volume gets added.
The sequence logic that reduces waste
The saved flows described in the campaign notes use a simple rule. Check whether the lead is connected before sending the next message. In the largest campaign, the path moves through profile view, like, and an IF_CONNECTED step before reaching InMail. In the best campaign, the flow includes a step to withdraw pending invites, which keeps the list cleaner and reduces dead weight.
That operating model is cleaner than staring at impression volume. It puts effort behind actual engagement status, not passive exposure.
What to do next
Build your review around one question, not five. Did the lead accept and reply? If yes, keep the conversation moving. If not, do not inflate the report with impression totals that cannot tell you what to do next.
For teams comparing channels and deciding where LinkedIn fits, this LinkedIn, email, and multichannel outreach comparison is worth reading alongside your own campaign data.
If your team wants to measure LinkedIn outreach on acceptance, replies, and follow-up logic instead of passive visibility, look at Flowkon. It is built to help sales teams run structured LinkedIn and email workflows, track the metrics that matter, and keep follow-up tied to actual engagement rather than impression noise. You can also start with a 7-day free trial.






.svg)

